
Berd · Technical White Paper
Vibration Damping in Cycling
The physics of viscoelastic spokes, and its application to the design of the Sparrow50 Gold: the world's fastest gravel wheels.
Abstract
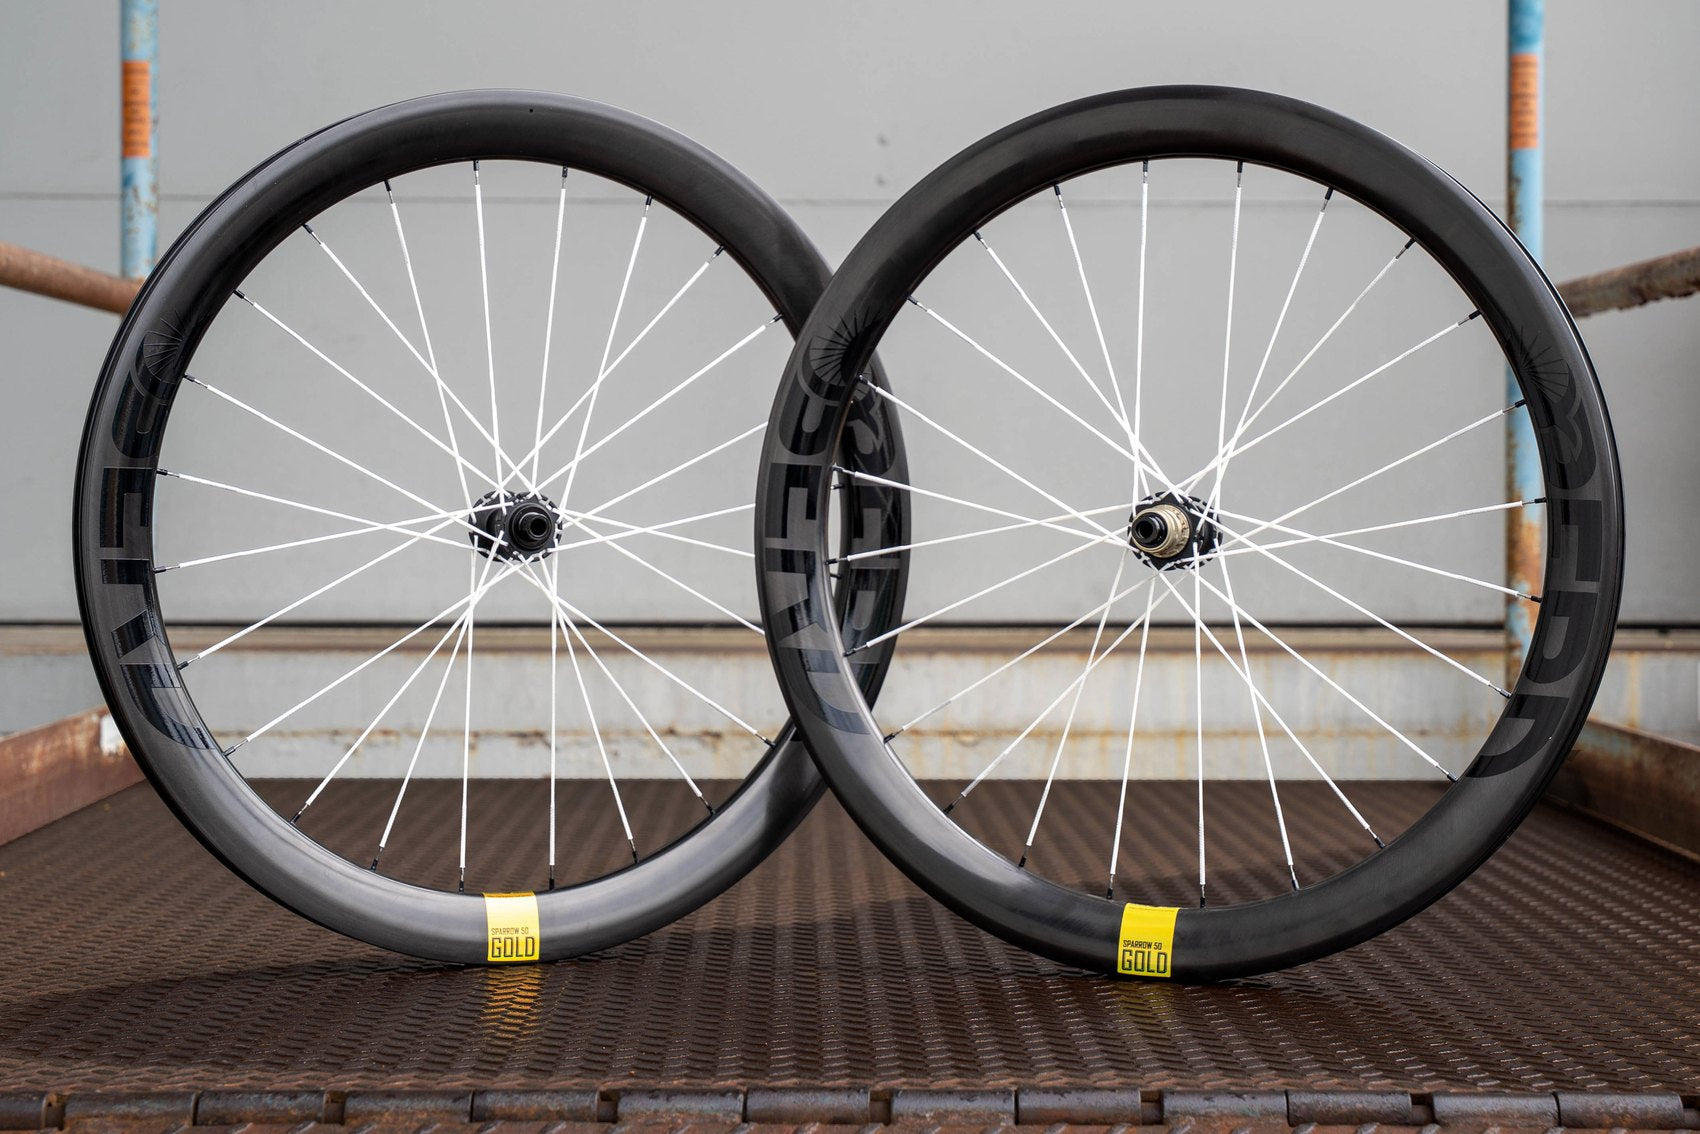
Efforts to make bicycles faster have concentrated on the two variables that are easiest to measure: aerodynamic drag and mass. In this white paper, we examine a third contributor to real-world speed that has received far less rigorous treatment: vibration damping. Building on established power-balance and field-testing frameworks, we describe the physics by which a viscoelastic spoke dissipates high-frequency vibration and we present rolling resistance and aerodynamic drag data for wheels with Berd spokes. We apply this framework to the design of the Sparrow50 Gold gravel wheelset, presenting the reasoning and evidence behind our position that it is the fastest and smoothest gravel wheelset available today.
1Background
Berd stands for “Bike Nerd” for good reason. We are a team of scientists and engineers and that training is the single largest input into how we make decisions at Berd. However, much of the research that makes us bike nerds has stayed out of public view. We have spent years optimizing the structural design of our spokes and wheels through rigorous engineering and testing. We have performed thousands of hours of research to automate our spoke and wheel production processes. We have characterized the reason our spokes have such amazing properties, but we have only published small fragments of it. This paper is an opportunity to change that, and to build on the excellent work others have done, including Robert Chung’s field-testing methods and the recent modeling efforts published across the industry.
Specifically, this paper provides a framework for one aspect of the bicycle that we believe is significantly underexamined: vibration damping. It is our attempt to move the vibration-damping reputation of our spokes from feel and anecdote to physics and numbers, to quantify this effect, to describe the mechanism in detail, and to show how we applied it in designing the Sparrow50 Gold, which we believe to be the fastest gravel wheelset in the world.
In the sections that follow, we begin by describing the molecular dynamics behind vibration damping in Dyneema and the full equations that define a cyclist’s speed, including the definition of a new concept for quantifying vibration damping. We then share both rolling-resistance and wind-tunnel data, and our method for estimating the time savings of the Sparrow50 Gold wheels for gravel racing and riding.
2Why Vibration Damping, and Why Our Spokes
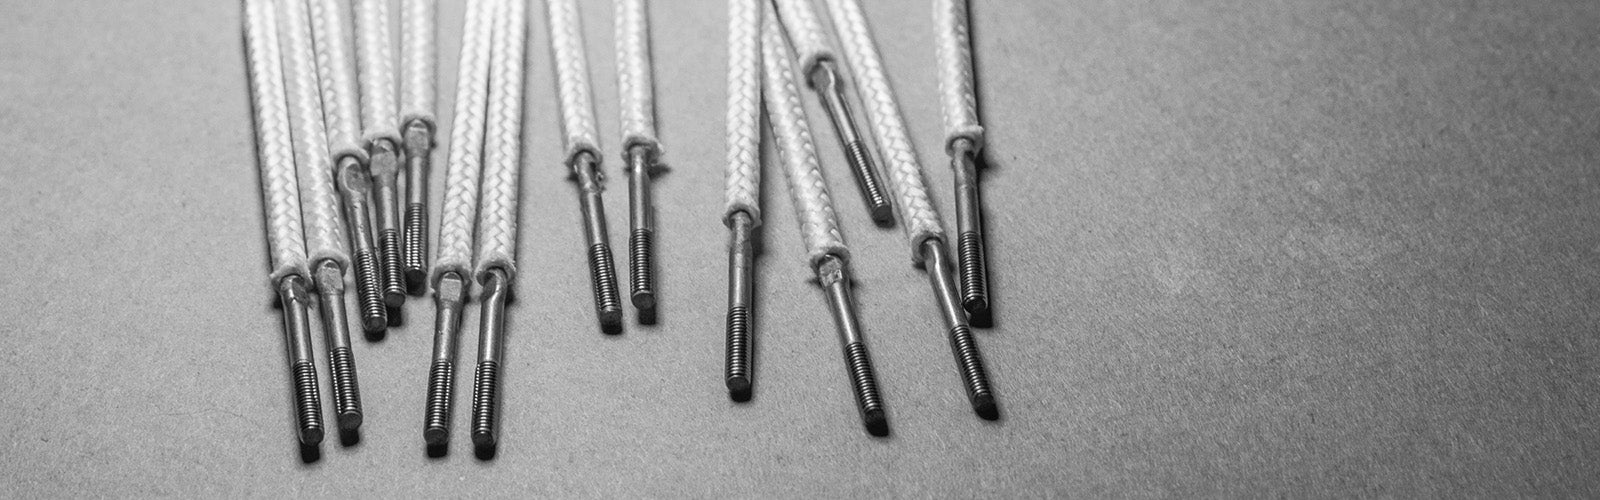
When we invented our spokes, we chose the material, braided ultra-high molecular weight polyethylene (UHMWPE; Dyneema) because it is exceptionally strong and lightweight. It wasn’t until years later that we realized the largest benefit of Berd spokes is the vibration damping, which leads to an exceptionally smooth ride.
We have tested this smoothing effect, akin to “riding a magic carpet,” many times over the years, most simply by measuring how quickly vibration decays in a wheel built with Berd spokes compared with an otherwise identical wheel built with steel spokes.1 The effect shows up as a vibration decay that is two- to three-times faster than with steel spokes. Alongside that laboratory work, we have heard the same thing from riders for years at every level of the sport: the wheels feel faster, and they feel smoother, and the two turn out to be related.
Some of the most striking feedback came from the very top of the sport. Rune Kristensen of Ineos Grenadiers built wheels with Berd spokes for his riders, and from notes of a 2024 call, he described their reaction after the first rides: they no longer wanted to race a mountain bike on steel spokes. The two riders he was equipping, Tom Pidcock and Pauline Ferrand-Prévot, each went on to win the cross-country mountain-bike gold medal at the 2024 Paris Olympic Games on Berd spokes. In a later independent, spokes-only back-to-back review, Escape Collective concluded that these Olympic-winning riders likely held “a small technical advantage” from the spokes.2 In the last 3 years, there have been 4 Olympic Gold medals, 4 World Championship Gold medals, and 50 world cup podiums across riders from 6 different professional teams.
Other independent testing points the same way. Using an accelerometer, Nolan Tsuchiya of The Bike Sauce measured small but repeatable reductions in vibration for wheels built with Berd spokes versus otherwise identical steel-spoked wheels, consistent with the energy-dissipating properties of the material.3
What we have learned in the years since is that this primary, albeit accidental, benefit comes from the fact that the material is viscoelastic.
3The Science of Viscoelasticity
A classic example of a viscoelastic material is silly putty. The reason for viscoelasticity is the long polymer chains in this material. When thrown quickly, silly putty behaves like an elastic solid. The polymer chains don’t have enough time to rearrange so the silly putty bounces. When left undisturbed, the same silly putty flows like a liquid because the molecules have time to move around each other. Dyneema is a super-material with roughly fifteen times the strength of steel, so there are obvious differences from the silly putty example, but the underlying mechanism for viscoelasticity is similar: Dyneema is composed of long polymer chains that behave in a substantially different way than traditional bicycle-spoke materials like stainless steel or carbon fiber.
Figure 1 shows a molecular view of stainless steel and a comparison to Dyneema. At the atomic level, stainless steel is fairly simple. Iron, chromium, nickel, and carbon (along with other elements in smaller concentrations) form a well-ordered arrangement that is essentially isotropic: no matter what direction you look at it from, it appears the same. When put under tension, the deformation is simple: the atoms move apart from one another. This is exaggerated in the figure, which shows the initial state as dotted lines and the movement of the atoms under load. An example of this is a steel ball dropped onto a steel anvil, a nearly perfectly elastic system: it returns almost all of its energy and rebounds to nearly the same height.
Dyneema, on the other hand, forms a very different structure at the atomic level. It is made of polyethylene, with a simple chemical makeup, just carbon and hydrogen, but a very complicated microstructure. The carbon and hydrogen form extremely long polymer chains, with covalent carbon-to-carbon bonds that have the strength of diamond when pulled along the length of the fibers. For the vast majority of the material, these chains are aligned along the length of the fiber and oriented into near-perfect crystals, represented by the top and bottom sections in the figure. These perfectly aligned chains give Dyneema its high stiffness and strength and are held together by van der Waals forces. Between these large crystalline sections are amorphous regions, illustrated as the middle section that ties the crystalline regions together.
It is in these amorphous regions that the damping is born. The chains are not locked into a rigid lattice; they retain a degree of molecular mobility, and when the fiber is loaded, they respond by trying to change their conformation to accommodate the force. There are many ways a chain can do this: a short segment can flex, a length of backbone can rotate, larger stretches can shift and partially uncoil.4 Each of these motions has its own length scale, its own resistance to change, and therefore its own characteristic time to take place. Some happen almost instantly. Larger, more cooperative rearrangements take longer.
Whether the material damps, and how much, comes down to the relationship between how quickly it is being loaded and how quickly these molecular motions can keep up. When the load changes on a timescale comparable to the relaxation time of one of these mechanisms, the chains are left perpetually chasing a force they cannot quite match, and that mismatch dissipates energy. This viscous friction at the molecular level causes vibrational energy to be lost inside the fiber rather than propagating to the hub, the bike, and the rider. The energy is converted into a small amount of heat that is quickly dissipated into the environment.
This frequency dependence is exactly why the same spoke behaves so differently under the two kinds of load a wheel actually sees. Under the slow, essentially static load of pedaling torque, Berd spokes behave as static tension members: spoke tensions hold steady and power transfer is unaffected. On the timescale of the polymer, torque is effectively a constant force. But under the fast, high-frequency buzz of the road, they cannot keep up, and the lag between load and response removes vibration on every cycle. Engineers call this dissipative property a material’s loss factor, and it is what separates a spoke that merely transmits vibration from one that quiets it. Different from Dyneema, both stainless steel and carbon fiber transmit vibrations extremely well. You can hear the difference: pluck a steel or carbon spoke in a wheel and it rings intensely.
The most important point is also the one most easily misunderstood: this is not a consequence of the material being less stiff. Damping and stiffness are different properties, and a material can be very stiff and still dissipate energy. Recall the steel ball on the anvil, which rebounds almost perfectly; a viscoelastic body dropped the same way absorbs a share of that energy instead of returning it. In steel, comparable internal dissipation only appears once you pass the yield point and bend the metal permanently, something that never happens to a spoke in normal service. Our spokes are different: they dissipate energy on every cycle while returning fully to their original shape each time. The viscoelastic deformation is entirely reversible; only the energy is not. That reversibility is why the spoke can damp continuously, cycle after cycle, without deforming or wearing.
4The Equation that Defines Speed
The physics of drag has been well described in research papers5,6 and recently in modeling the finish time for the purpose of improving cycling components by others in the industry. According to Martin, who was one of the first to validate this model in 1998 with experimental data, the power required to propel a bicycle can be modeled as a sum of six sources of drag:7
Power = Aerodynamic Resistance, Rolling Resistance, Frictional Losses in Wheel Bearings, Changes in Potential Energy, Changes in Kinetic Energy, and Frictional Losses in the Drivetrain
In the equation below, this expression for power is written with variables only including the four terms that are important for comparing bicycle wheels. It is simplified compared to the more complex equation written by Martin by ignoring frictional losses in wheel bearings and by assuming the grade is less than 10%. The rider’s input power, P, is multiplied by drivetrain efficiency, η, to account for the frictional losses in the drivetrain, which is assumed to be 0.97 for the modeling within this paper:

The first term of this equation, ½·ρ·CdA·v3, represents the power to overcome aerodynamic resistance. ρ is the density of the air, v is the effective longitudinal air velocity, and CdA is the coefficient of drag times the combined total frontal area of the bike and rider. CdA is a function of the yaw angle, which is the angle between the rider’s direction of travel and the effective air velocity. For the purposes of modeling within this paper, CdA is assumed to be the total of a fixed value for CdA representing the rider plus bike, and a variable value for CdA that represents the wheels (and is a function of the particular wheel model tested). Ignored from this equation is the aerodynamic power term associated with wheel rotation, which is assumed to be nearly constant among wheel models. Aerodynamic drag scales with velocity cubed and is the dominant form of resistance on smooth, flat, ground at high speeds.
The second term of the equation, Crr·m·g·v, represents the power to overcome rolling resistance. Crr is the coefficient of rolling resistance, m the combined mass of rider and bike, and g is the acceleration of gravity. Absolute values for Crr are notoriously difficult to measure, because they are a function of tire composition, temperature, the specific bike setup, riding surface conditions, and other factors. However, values for a particular set of conditions can be repeatably measured, in particular, with a method described by Robert Chung known as the “virtual-elevation method.”8 A further description of this method along with data is presented in Chapters 5 and 6. While rolling resistance drag only scales with velocity to the first power, at slower speeds (such as those present in gravel cycling) and on rough surfaces (such as very rough gravel or grass) it can become the dominant form of drag, accounting for up to 69% of the total drag.9
The third term of the equation, m·g·sin θ·v, represents the power to overcome the change in potential energy due to gravity. This term becomes the dominate resistance when climbing steep hills.
Finally, the fourth term of the equation, meff·a·v, represents the power required to overcome changes in kinetic energy, which is the power required to change speed. The effective mass, meff, is the total mass of the rider and the bike plus the inertia of the wheels. The weight at the rim and spoke counts roughly double in every acceleration due to their inertia. During large accelerations, particularly those starting from slow speeds, inertia becomes the dominant form of resistance.
In the bicycle industry, there is no shortage of weight and aerodynamic-based data published for bicycle components. Rolling resistance on smooth ground, particularly tire rolling resistance, is also well described by, for example, bicyclerollingresistance.com. However, the effect of bicycle components on the rolling resistance on rough ground is much less frequently published on and discussed, and this is the subject of the next Chapter.
5Introducing a New Definition for Rolling Resistance
The virtual-elevation method is often considered the most reliable and trusted approach for measuring the coefficient of rolling resistance in cycling, especially for the purposes of comparing tires for off-road riding10,11,12. This approach involves finding a closed loop of road or trail and riding it repeatedly while recording speed and power with a calibrated power meter. Rather than measuring elevation directly, the method inverts the power balance equation: for a given set of CdA and rolling-resistance Crr coefficients, the rider's power, speed, and acceleration at each instant are used to solve for the only remaining unknown, the change in height, which is integrated over the ride to reconstruct a "virtual" elevation profile. Because the loop returns to its starting point, the true elevation profile must close on itself, and any drift or mismatch between laps signals that the assumed CdA and Crr are wrong. The analyst then adjusts the two coefficients until the virtual profile both closes and overlays cleanly from lap to lap; the values that achieve this are the best estimates of the aerodynamic drag and rolling resistance. Its strength for tire and surface comparison is that it isolates the variable of interest: by riding the same loop, at the same pressure, with only the tires (or wheels) changed, everything else in the equation cancels, and the difference in fitted Crr is attributable to the component under test.
Recently, John Karrasch has been compiling and publishing data for tires on various surfaces including smooth pavement, “Cat 1” gravel, “Cat 2” gravel, and “Cat 3” gravel.
| Cat 1 | Smooth, well-maintained dirt roads with no or very little gravel chunks. |
| Cat 2 | Medium, rougher, loose gravel with some washboarding, ruts, and loose patches. |
| Cat 3 | Rough, chunky, loose gravel with larger rocks and washed-out sections. |
This data that Karrasch and others present is typically presented as a single Crr that encompasses, for Cat 3 gravel for example, both the inherent rolling resistance of the tire and the additional rolling resistance caused by the rough surface. Here we would like to suggest a new definition of Crr that includes both a term for the rolling resistance on smooth pavement Crr,0, or tire floor, and a second term for the roughness surcharge, Crr,rough, that represents the additional rolling resistance caused by the particular grade of rough gravel. Figure 3 shows representative Crr data that John has published for a 45 mm Schwalbe G-One RS Pro tire across four different surface grades.
The smooth-road floor is the energy lost inside the tire itself: with every revolution the casing and rubber flex through the contact patch and, being imperfectly elastic, return slightly less than they take. This loss is present on any surface, even glass-smooth pavement, and it is set almost entirely by the tire's construction and its inflation pressure. For a low rolling resistance gravel tire, this value is around 0.004.
The roughness surcharge is the additional loss the surface imposes. On a smooth surface, it is zero by definition.
In the example in Figure 3, the roughness surcharge grows from 0.004 on Cat 1 gravel 0.0130 on Cat 3 gravel, which is a fourfold overall increase compared to smooth pavement.
A good example to help understand this would be to imagine a rider on smooth pavement going at a fixed speed and then encountering rough gravel. At this point, the rider will need to expend additional power that is proportional to the roughness surcharge (Crr,rough·m·g·v) to continue traveling at the same speed.
The power required to ride on a rough surface is likely a combination of multiple factors including the power required to deform the ground, the power required to lift the rider and bike up over the bumps, and the power consumed in vibrating the rider and bike. Lifting the rider, for example, over mm-sized bumps hundreds of times per second consumes energy that is not likely fully returned on the way back down. The descent is absorbed in the tire, in the frame, in the rider’s own body, and dissipated as heat rather than converted back to forward motion. A rough surface, in effect, forces the rider to perform a long series of tiny climbs that are never repaid. These are often called impedance, or suspension, losses, and on gravel they can contribute to a large loss of the rider’s power. The scale of this loss is increasingly recognized across the sport and has recently been measured directly with on-bike race telemetry.13
As mentioned previously, rolling resistance is dependent on many variables, but two dependencies are especially important. The first is temperature: as a tire cools, its casing stiffens and its hysteretic losses climb steeply. Recent real-world testing has measured rolling resistance rising on the order of two to three percent for every degree Celsius below roughly 15 °C, swings of many watts, larger than the difference between two different tires.14 The second is pressure, which has its own optimum for every combination of tire, load, and surface: too high and vibration losses grow, too low and the casing deforms and squirms.
We propose that there are two distinct modes for reducing the roughness surcharge: impact reduction and vibration reduction. Low-frequency impacts (the square edges, ruts, and rocks) are reduced by compliance: letting the wheel move so the rider’s mass is not thrown as far. Small, high-frequency vibration (the buzz and chatter, quantified in exposure terms by standards such as ISO 263115) is reduced by damping: dissipating that oscillation before it can re-transmit. We name the two reductions for the input each removes:
CIR · Impact reduction the bumps: low frequency, large hits Mechanism: compliance. The system yields, so the mass is lifted less.
|
CVR · Vibration reduction the buzz: high frequency, fine chatter Mechanism: damping. The oscillation is dissipated rather than returned.
|
The table above is meant to show some potential representative examples and suggestions of components and the category that they might fit into. Berd spokes are one of the few tools that not only damp extremely low to the ground, but also save weight compared to metal spokes, for example.
These two new coefficients, CIR and CVR, act in series, which is why we propose they both have the potential to reduce the roughness surcharge (and ultimately the overall roughness) with a simple multiplicative expression for Crr:
Where CIR and CVR are, by definition, less than 1. We anticipate that in practice these coefficients will be measured as relatively small values (e.g., <0.1) due to the physical constraints of removing all impacts or vibrations without any energy loss.
This equation is intuitive, because it is common knowledge, for example, that dropping tire pressure or moving from a rigid bike to full suspension will make a bike faster on rough surfaces. These things would effectively increase CIR, which in turn lowers the overall Crr.
Similarly, components that reduce vibration, such as Berd spokes, should increase the coefficient of vibration reduction and in turn lower the overall Crr. The goal of these new definitions is that the coefficients of vibration reduction and impact reduction are more universal terms than absolute Crr comparisons and thus they can be more easily applied across different sets of systems and conditions and used for finish time modeling.
6Quantifying the Vibration Reduction of Berd Spokes
Karrasch used the virtual-elevation method to compare the overall coefficient of rolling resistant on a wheelset with Berd spokes and a comparable wheelset with steel spokes. The comparison was done on Cat 3 gravel as shown in Figure 4.

The two wheelsets were a Berd HAWK30 Gold (32-inch) and an otherwise comparable baseline built with a carbon rim, DT 240 hub, and double-butted steel spokes, both on identical Maxxis Aspen 2.4-inch tires. On smooth pavement the two were identical: 47 W per pair of tires at 30 km/h, a rolling coefficient of 0.0057 for both. On the singletrack the Berd wheel was measurably faster: 169 W against 174 W, a coefficient of 0.0226 versus 0.0232. This result is both significant and important. Measuring Crr with this method has a repeatability of less than 0.0001, and a 5 W power savings is enough to make a substantial difference in the finish time in endurance gravel riding and racing.

The saving of 0.0006 in Crr , about five watts at 30 km/h, is the damping acting on the roughness surcharge. In this system, this gives a CVR of 0.055 by subtracting the smooth-road floor and dividing by the Crr,rough. The equivalent values for rolling resistance on smooth gravel is consistent with the modeled mechanism, where the benefit appears only where there is roughness to dissipate. These results were measured on 32-inch wheels (which happened to be the only system tested by Karrasch at time of this publication). Because the damping is a property of the spoke itself, the result is transferable to the Sparrow50 Gold, which uses the same spokes.
7Aerodynamics
Of the four forces, aerodynamic drag is the largest at high speeds, because it grows with the cube of velocity. On gravel it shares the importance with rolling resistance rather than dominating it, but it still decides the fast, smooth sections of any course. A gravel wheel must therefore be extremely fast in the wind as well as smooth over the ground.
We measured the Sparrow50 Gold and the leading aerodynamic gravel wheels at the A2 Wind Tunnel in Mooresville, North Carolina. Every wheel was tested as a front wheel, in the same fork, with the same 50 mm Schwalbe G-One RS Pro tire, at the same air density, so the comparison isolates the wheel itself. Drag was recorded across a full sweep of yaw angles rather than head-on only, because a gravel wheel meets the wind from a range of angles in real riding. The compiled data in Figures 7, 8, and 9 estimates complete wheelset aerodynamic drag by multiplying the front wheel drag by a factor of 1.5.

Aerodynamic drag depends on yaw: the angle between the bike's heading and the apparent wind. A wheel that is fast head-on can behave differently in a crosswind, so a single drag figure is meaningful only if it reflects the angles a rider actually sees. Real riding is dominated by low yaw, where the apparent wind sits within roughly ±7° of straight ahead about 86% of the time. A representative CdA therefore weights those low angles most heavily, the same real-world weighting the wider industry, including Specialized, applies.16 The values below are yaw-weighted on that basis.
The Sparrow50 Gold is 14.3% more aerodynamic than the Sparrow it replaces, achieved through a redesigned rim profile and new equal spoke length hubs. It brings the Sparrow50 Gold into the company of the most aerodynamic gravel wheels ever made: it trails only by a small margin of drag area, while being the only wheel among them built on vibration-damping spokes. On the smooth, fast sections where aerodynamics rules, the Sparrow Gold is now fully competitive. At 32 km/h, the Sparrow50 Gold has 1.7 W of additional aerodynamic drag than the Zipp 303 XPLR SW and 0.8 W of additional aerodynamic drag compared to the ENVE G SES 4.5. On the rough sections where the earlier chapters showed the larger losses hide, the Sparrow50 Gold holds an advantage none of the others share.
The Sparrow50 Gold drag depends on the tire fitted to it: a larger tire presents more frontal area and disturbs the junction where rim meets casing, raising CdA. Across the three sizes the effect is clear and a near-linear relationship for these three tire sizes.
A larger tire raises aerodynamic drag here, yet Chapter 5 showed it lowers the rolling-resistance surcharge on rough ground. Tire width is a direct trade between the air term and the surface term, and the only way to resolve it is to put both into the equation of Chapter 4 and solve for finish time. Similarly, to compare wheel models, we can now use the measured rolling resistance and air resistance data, to determine the fastest wheels on representative courses. That is the subject of the next Chapter.
8The Complete Picture: Calculating Finish Time
Having described not only the model, but also the data we are using as inputs into our model, we can quantitatively compare the Sparrow50 Gold wheels to the other highest-performing gravel wheels on the market by calculating finish time for a given course and rider information. Everything here also runs in our new finish time calculator at berdspokes.com, so any rider can enter their own numbers and calculate their own results.
The following equations are used in the finish time calculator by solving for finish time numerically to allow for uneven speeds and changing grades.
where Crr = Crr,0 + Crr,rough(1 − CIR)(1 − CVR)
For the wheel-dependent terms we use the aerodynamics measured in Chapter 7 and the rolling resistance measured in Chapter 6. Every wheel carries the same tire, so the system rolling coefficient is Karrasch's measured value for a 50 mm tire on the chosen surface. The values used for CdA, CVR, and weight are shown in Table 1 below. The rider and frame contribute an assumed fixed CdA of 0.34 m², and the assumed drivetrain efficiency is 0.97.
Table 1. Wheel-model inputs to the finish-time model: yaw-weighted drag area CdA, vibration-reduction coefficient CVR, and wheelset weight.
| Wheelset | CdA (m²) | CVR | Weight (g) |
|---|---|---|---|
| Berd Sparrow50 Gold | 0.0385 | 0.05 | 1,298 g |
| Berd Sparrow (2025) | 0.0451 | 0.05 | 1,050 g |
| Zipp 303 XPLR SW | 0.0353 | 0 | 1,452 g |
| ENVE G SES 4.5 | 0.0362 | 0 | 1,565 g |
| Stock Gravel Wheelset | 0.0460 | 0 | 1,800 g |
The rolling coefficients used in the calculator are Karrasch’s measured values for the three Schwalbe G-One RS Pro widths. Aerodynamically, relative to the 50 mm baseline, the 45 mm tire lowers wheel drag area by 0.0035 m² and the 55 mm raises it by 0.0034 m².
Table 2. Rolling-resistance inputs for the three Schwalbe G-One RS Pro widths: the smooth-surface floor Crr,0 and the roughness surcharge Crr,rough at each gravel category.
| Tire (G-One RS Pro) | Crr,0 | Crr,rough Cat 1 | Crr,rough Cat 2 | Crr,rough Cat 3 |
|---|---|---|---|---|
| 45 mm | 0.0042 | 0.0040 | 0.0071 | 0.0130 |
| 50 mm | 0.00425 | 0.0040 | 0.0069 | 0.0120 |
| 55 mm | 0.0043 | 0.0040 | 0.0067 | 0.0110 |
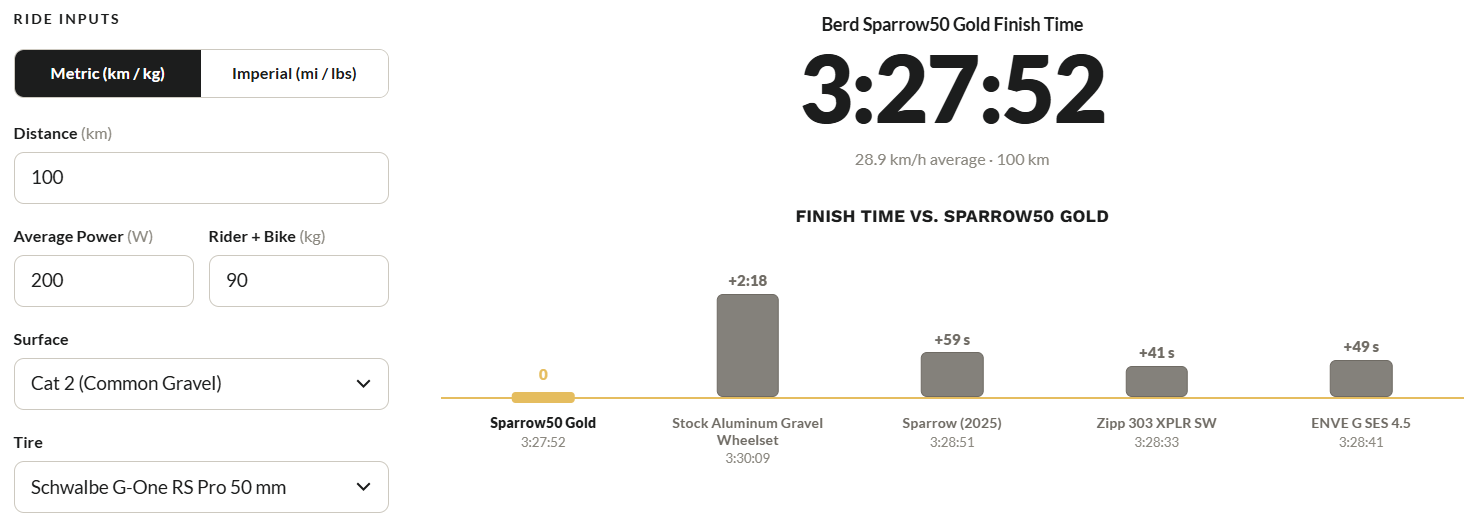
In its most simplistic version, the calculator allows a user to calculate the finish time based on input distance, rider weight, average power, gravel type, and tire width. The calculator returns a finish time for each wheel and comparative time. Figure 10 shows an example from the finish time calculator for a 100 km Cat 2 gravel course at 200 W and 90 kg on 50 mm tires. The Berd Sparrow50 Gold wheels show a significant time savings over not only the previous generation wheels but also the competitor’s wheels.
Another interesting comparison is the finish time across three tire widths and the three classifications of gravel (Figure 11). This example shows that there is no single fastest tire width, but rather a fastest width for a surface.
The comparison of gravel tires is meant to be illustrative and not all encompassing. This particular example is based on real aerodynamic and vibration testing data, but this doesn’t mean that on every bike, every setup, every tire manufacturer, etc. that a 55 mm tire is the ideal tire for Cat 3 gravel. The calculator described here is a relatively simplistic starting place, but Berd intends to add complexity in the future that allows our customers to model the benefits of more tires on more complicated courses. Is this sort of analysis necessary to ride off-road? Absolutely not. Does this calculator and introduction of new vibration-damping ideas help provide a framework for additional data, additional testing, and new products that have yet to be developed? We hope so.
In this paper, our goal has been to be open with the science and equations that we have used in our marketing claims and to calculate finish times in gravel cycling so that others can use this, build from it, and enjoy being a bike nerd as much as we do.
9The Sparrow50 Gold
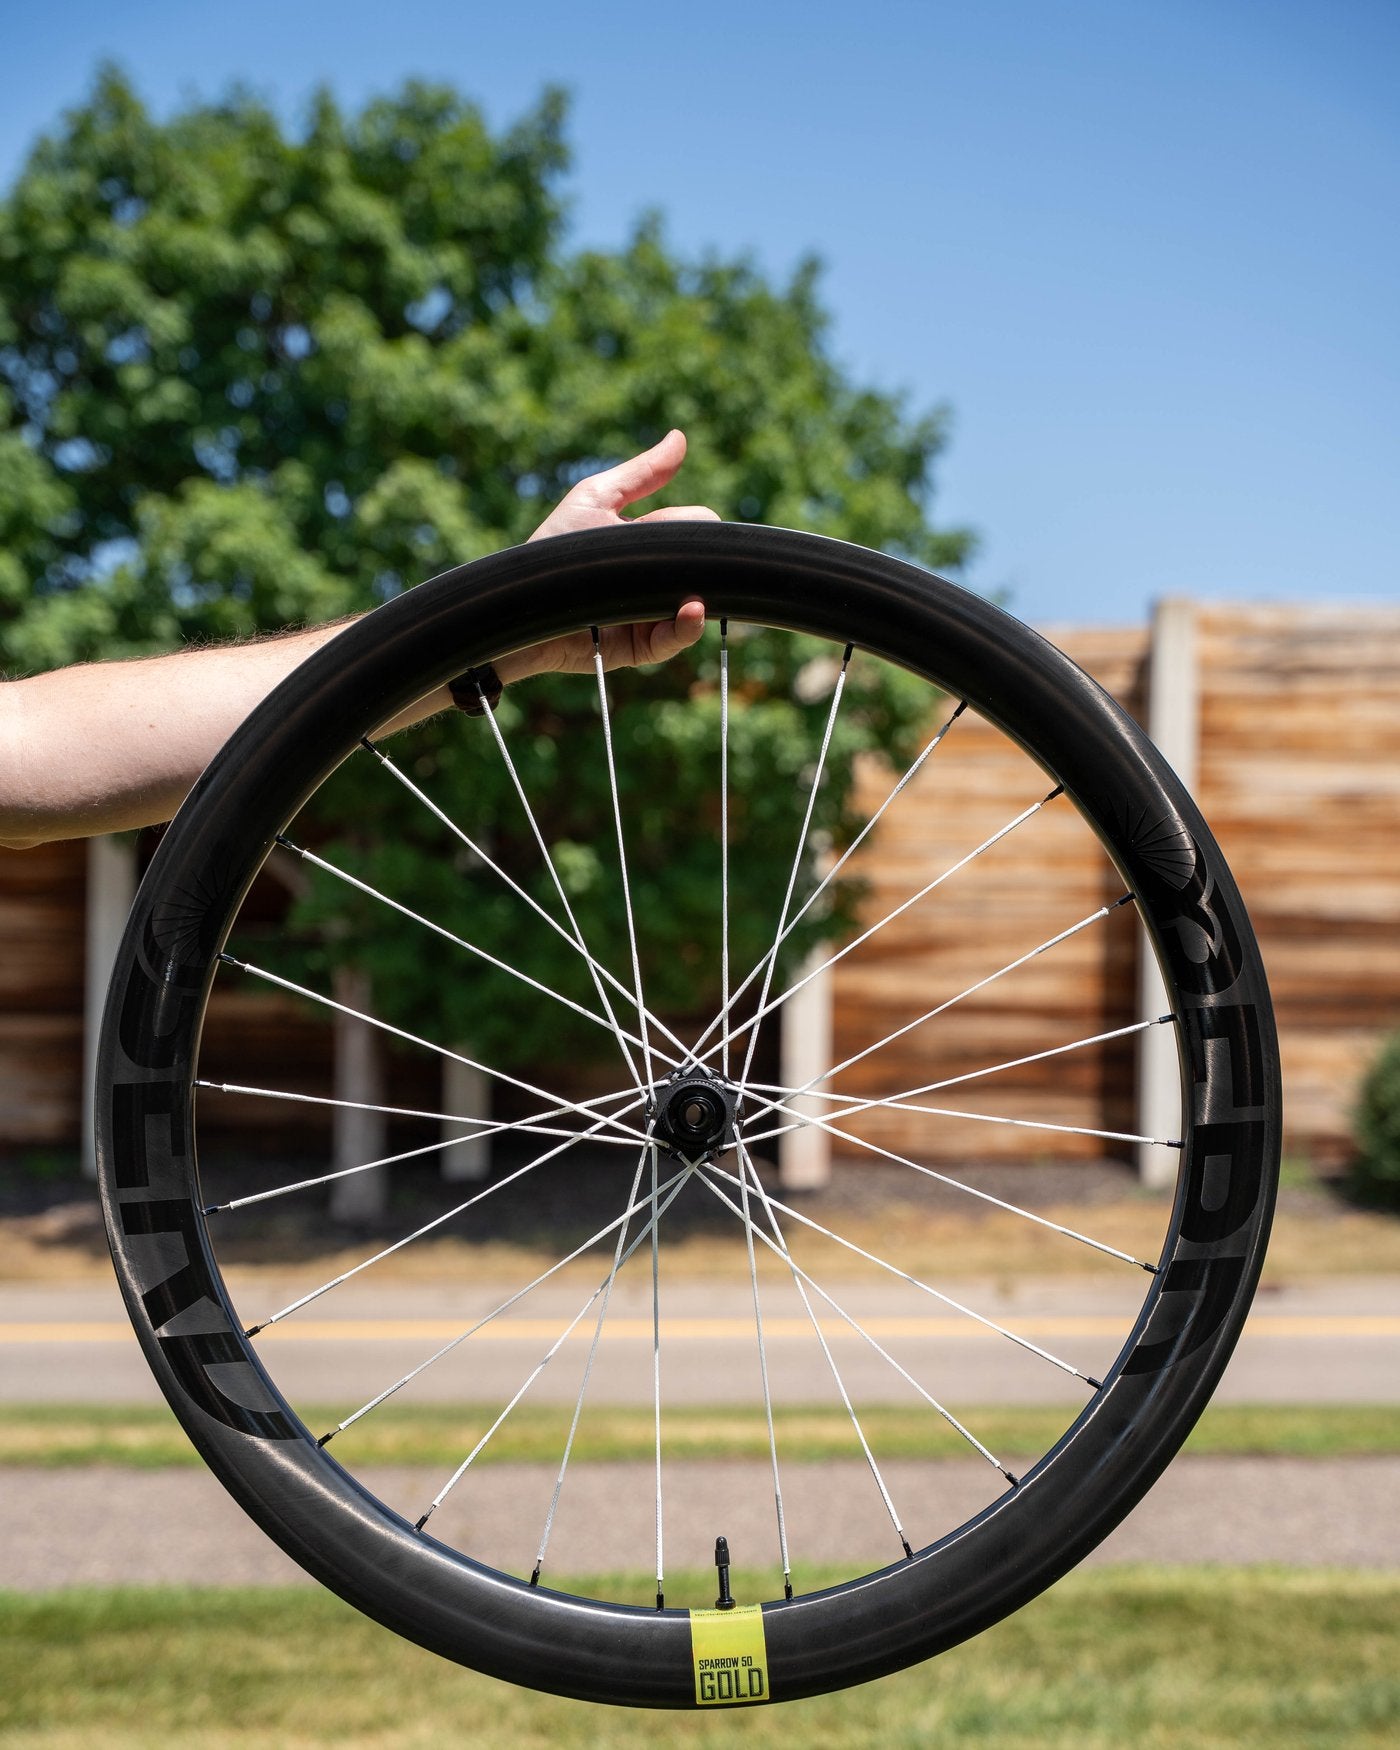
The Sparrow50 Gold is 14% more aerodynamic than our previous-generation Sparrow, with vibration damping no aero rival can match. In our finish-time modeling, that combination pulls ahead of wheels like ENVE and Zipp as the gravel turns rough.
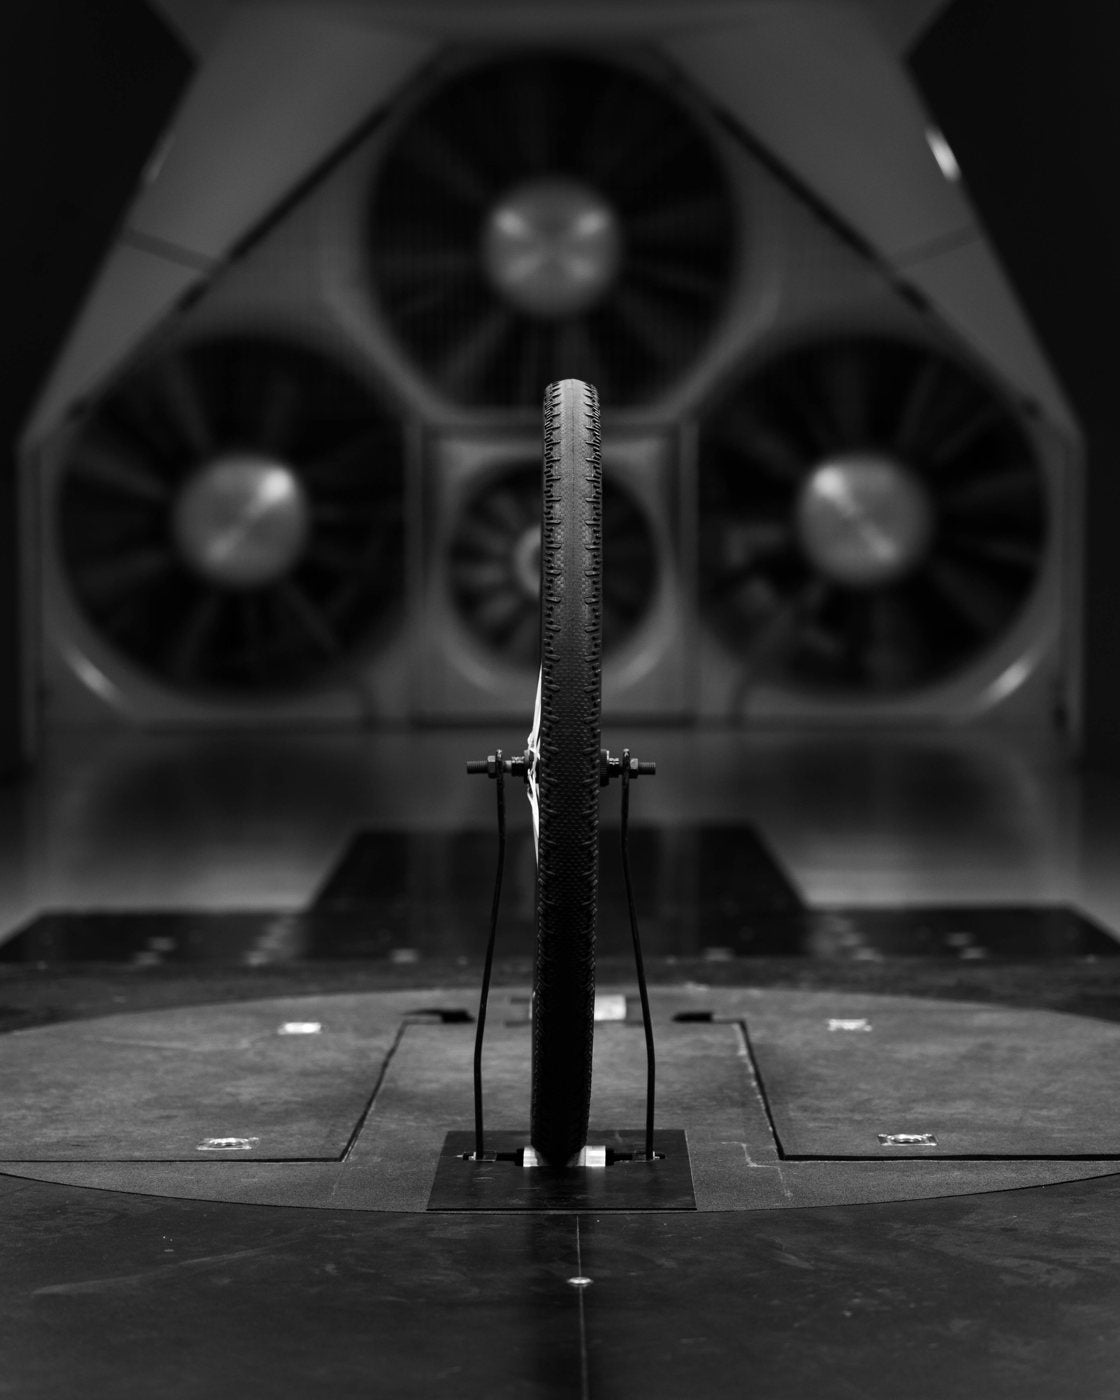
A redesigned 50 mm rim against the fastest aero-gravel wheels on the market and optimized with Schwalbe for 45 to 55 mm tires. It runs with the quickest of them, and it is the only one that also damps vibration.
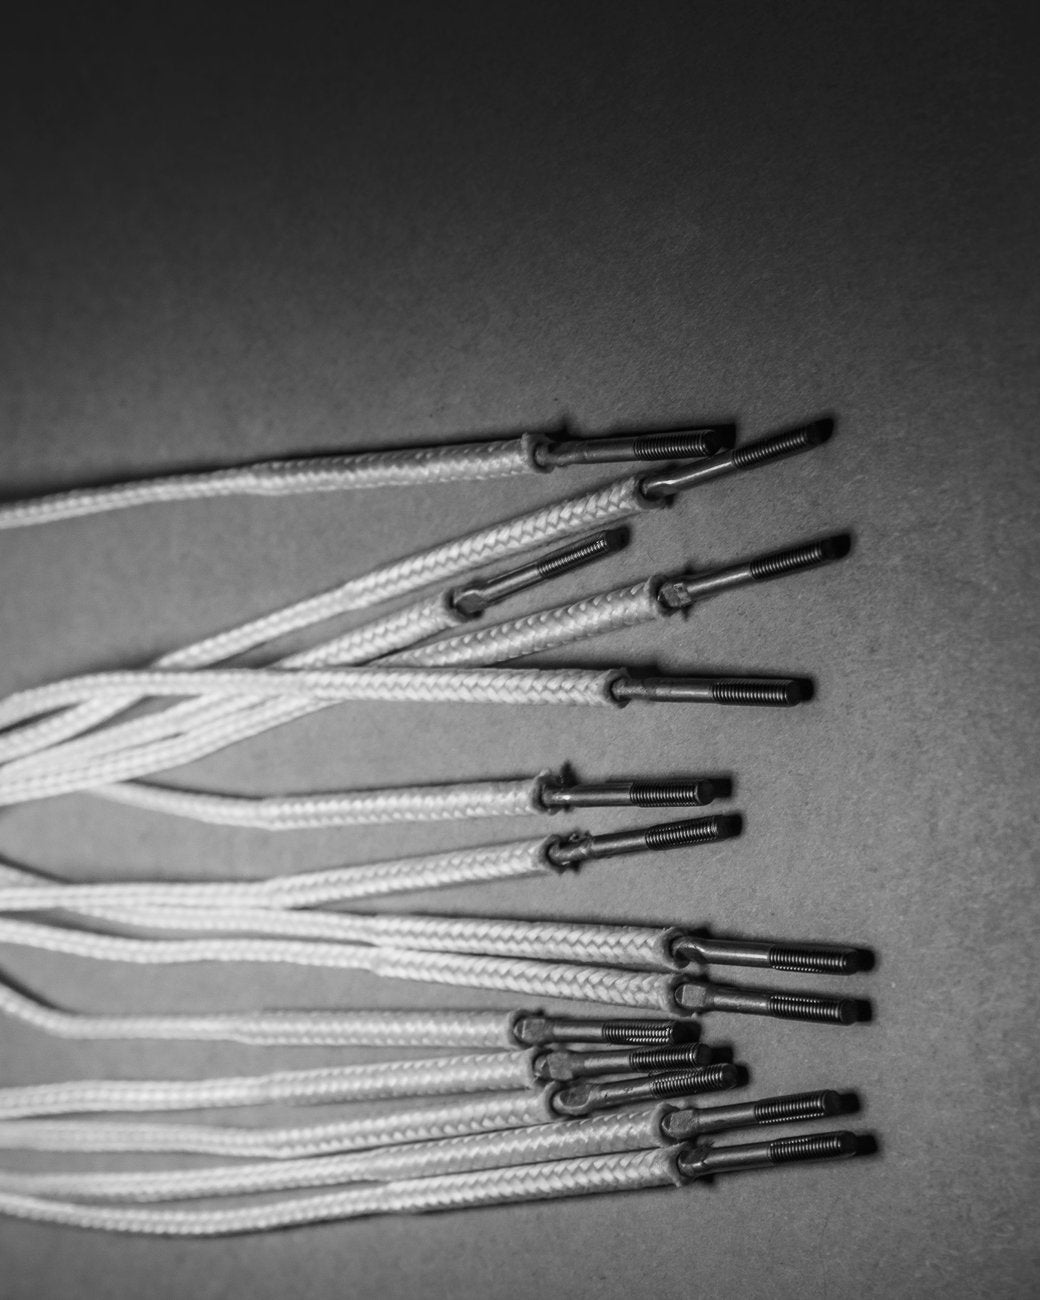
Berd PolyLight spokes are the only spokes that use viscoelastic damping to dissipate high-frequency vibration, energy the fiber sheds rather than returns to the rider. No steel spoke can do it. Less buzz reaches your hands, arms, back, and saddle, so you finish long gravel days fresher and stronger.
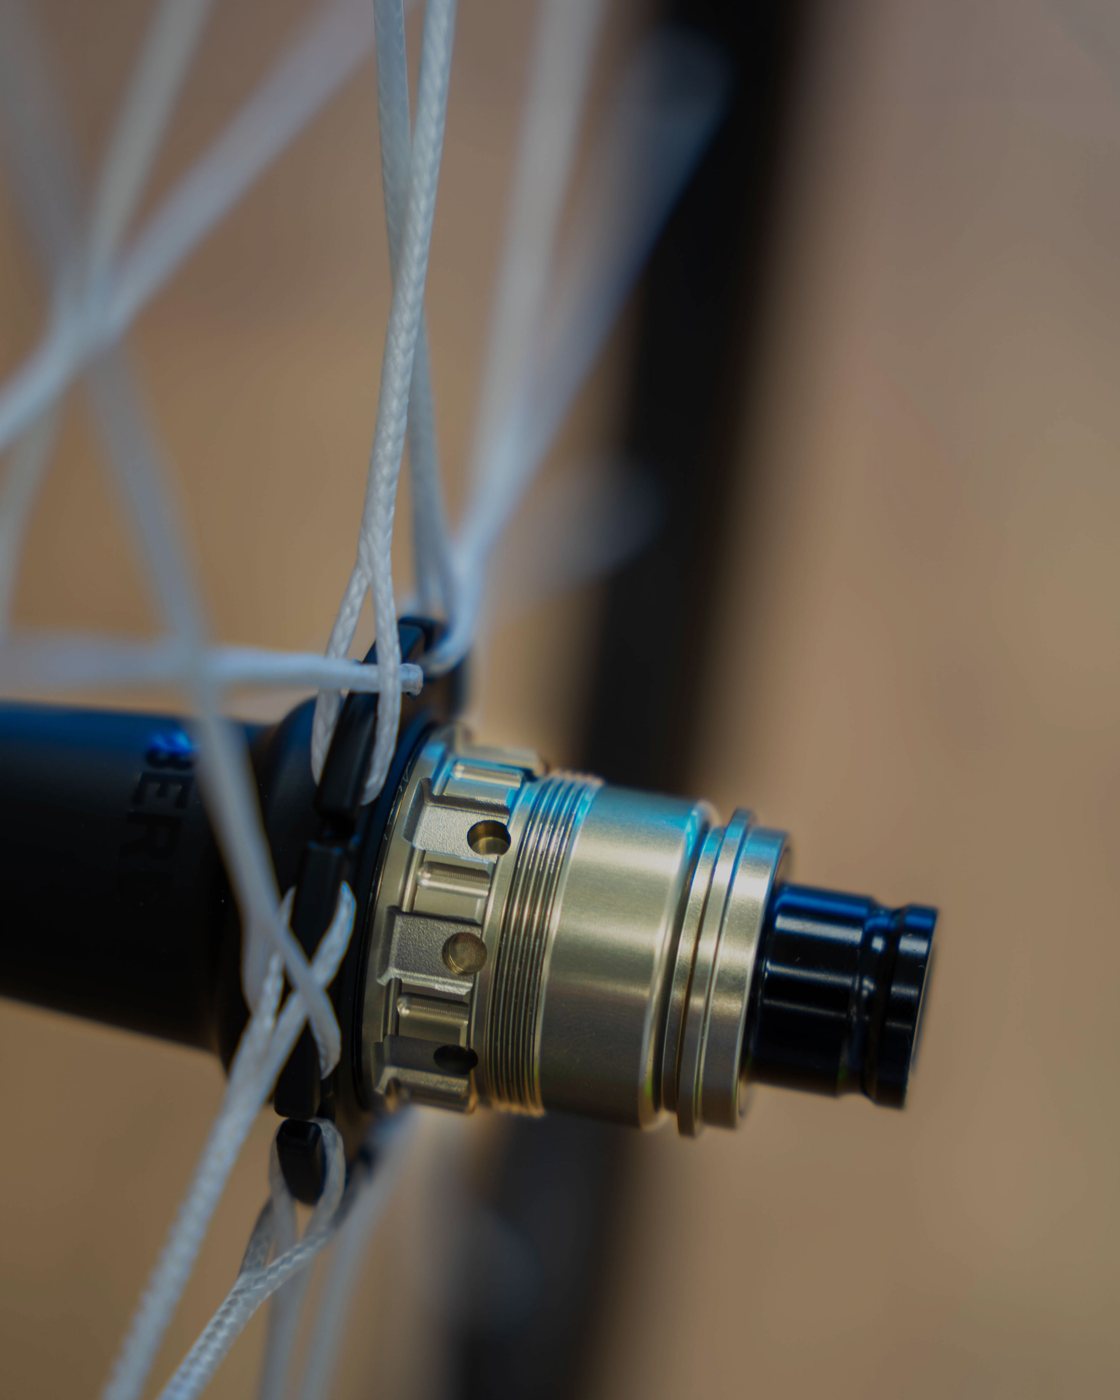
The Talon ESL-R is our fastest gravel hub yet: a lightweight dual-sprung 36-tooth ratchet for instant engagement, a TriCoat™ aluminum freehub that resists cassette bite, and front end caps that convert between 12 and 15 mm axles in seconds, with no tools.
Rims
| Rim depth | 50 mm |
| Internal rim width | 30 mm |
| External rim width | 38 mm |
| Wheel size | 700c (29″, 622 mm BSD) |
| Rim ERD | 541 mm |
| Spoke holes | 24 front and rear |
| Brake | Disc, Centerlock |
| Tubeless | Ready |
Hubs
| Front & rear hub | Berd Talon ESL-R |
| Freehub ratchet | 36-tooth, dual-sprung |
| Freehub body | SRAM XD, Shimano Microspline, Shimano HG, or Campagnolo N3W |
| Freehub material | TriCoat® aluminum |
| Front spacing | 12 × 100 or 12 × 110 mm (to 15 mm) |
| Rear spacing | 12 × 142 or 12 × 148 mm |
Spokes
| Spokes | Berd PolyLight, 259 mm front and rear |
| Nipples | Sapim aluminum, double-square secure lock |
Tires
| Tire compatibility | 40–60 mm (1.50″ to 2.35″) |
| Max pressure | 60 psi (4.14 bar) |
| Setup | Tubeless or tube-type clincher |
Weight
| Wheelset | 1,298 g |
| Front | 600 g |
| Rear | 698 g |
| Note | Without rim tape and valves |
General
| Rider weight limit | 280 lb / 127 kg |
| Warranty | Lifetime against manufacturing defects |
| Crash replacement | Free rim crash-replacement program |
| Price | $2,395 |
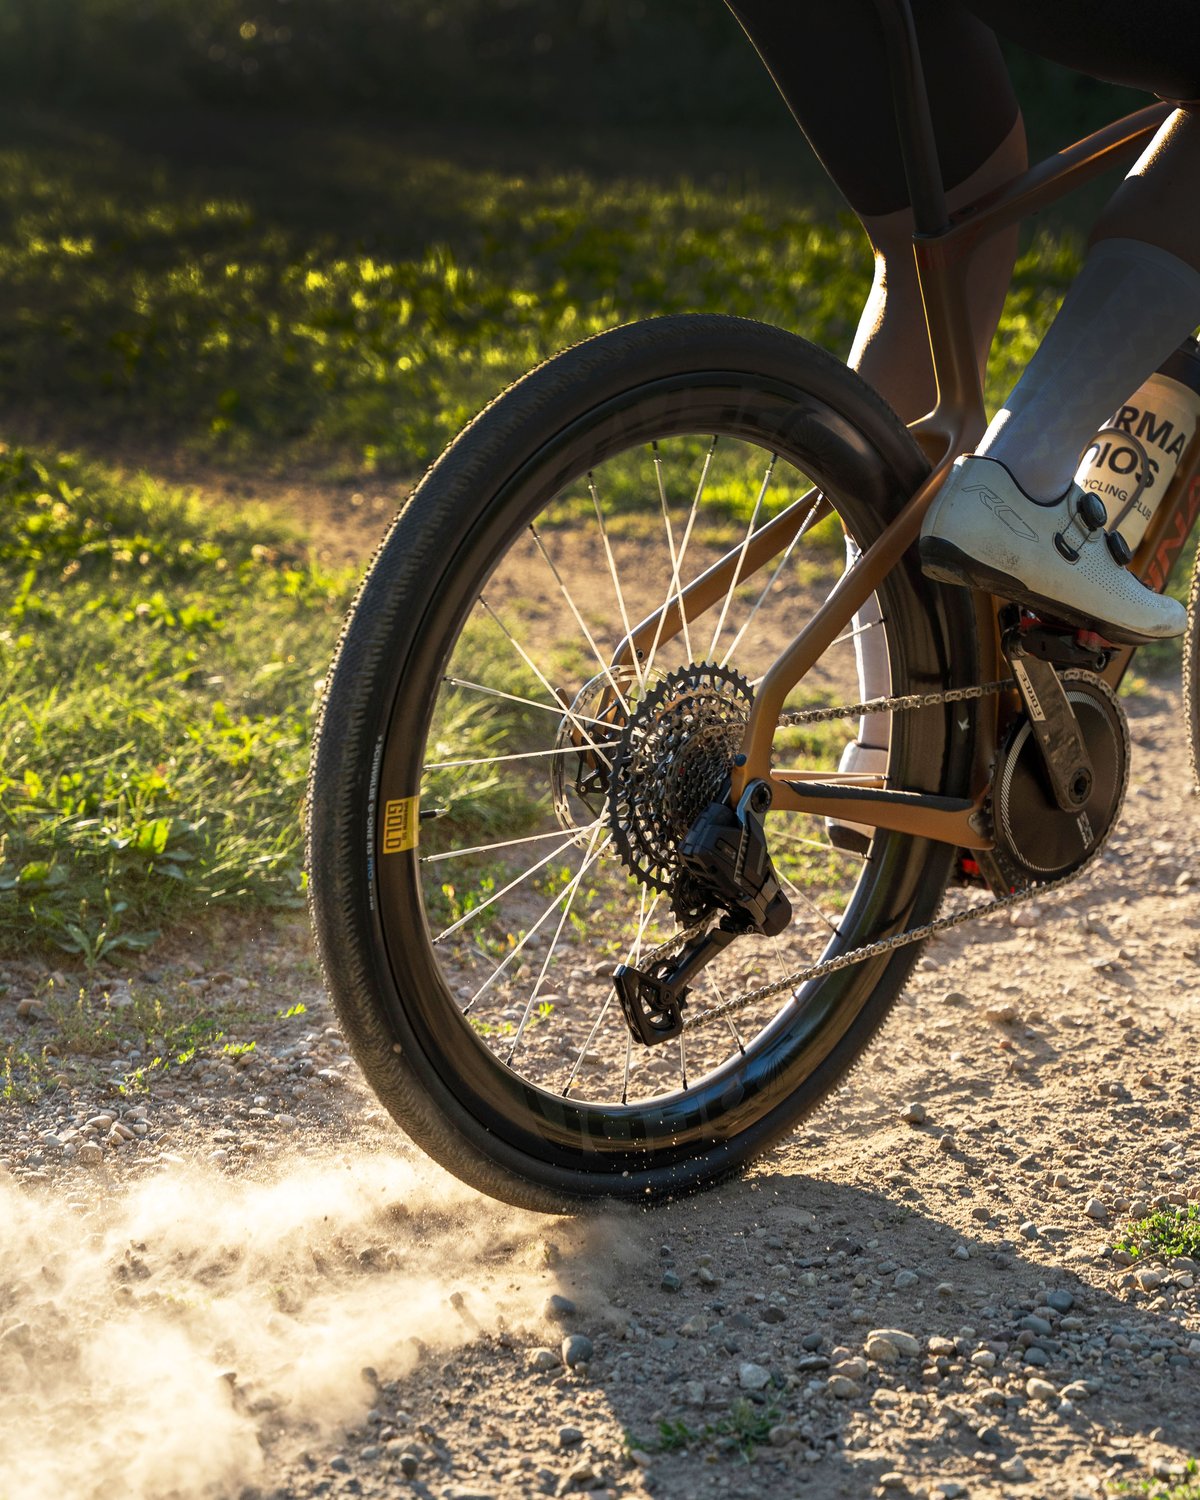
Faster through the air. Quieter over the ground. Fresher at the finish. The Sparrow50 Gold, the fastest and smoothest gravel wheel in the world.
Acknowledgments
The account of the molecular origin of viscoelastic damping in Chapter 3 was informed by helpful correspondence with Marc Kanters of Avient (Dyneema) and Frank Bates of the University of Minnesota, whose guidance on the relaxation mechanisms in semi-crystalline polymers is gratefully acknowledged. We thank John Karrasch for generously providing his rolling-resistance test data, and Geoff Eaker for his help with the wind-tunnel testing. Finally, we thank the entire Berd team, whose work made the Sparrow50 Gold possible.
References
- Berd. “PolyLight spoke technology.” berdspokes.com/pages/technology (accessed 2026).
- Rome D. “Diving deep: Reviewing Berd polymer vs steel-bladed spokes.” Escape Collective, 23 February 2026. escapecollective.com
- Tsuchiya N. “The Bike Sauce” (YouTube channel). TESTED: Polymer vs Steel Spokes // Vibration Analysis. Oct 12 2025.
- Boyd R.H. “Relaxation processes in crystalline polymers: experimental behaviour, a review.” Polymer, 26(3):323–347, 1985.
- Debraux P, Grappe F, Manolova AV, Bertucci WM. “Aerodynamic drag in cycling: methods of assessment.” Sports Biomechanics, 10(3):197–218, 2011.
- Crouch TN, Burton D, LaBry ZA, Blair KB. “Riding against the wind: a review of competition cycling aerodynamics.” Sports Engineering, 20(2):81–110, 2017.
- Martin JC, Milliken DL, Cobb JE, McFadden KL, Coggan AR. “Validation of a Mathematical Model for Road Cycling Power.” Journal of Applied Biomechanics, 14(3):276–291, 1998.
- Chung R. “Estimating CdA with a power meter.” 2012.
- Bertucci, W. M., & Rogier, S. (2012). Effects of different types of tyres and surfaces on the power output in the mountain bike field conditions: A preliminary study. Computer Methods in Biomechanics and Biomedical Engineering, 15(Suppl. 1), 234–236. doi:10.1080/10255842.2012.713605
- “Reliability of the virtual elevation method to evaluate rolling resistance of different mountain bike cross-country tyres.” PubMed 28282753. pubmed.ncbi.nlm.nih.gov/28282753
- Anhalt T. “Blather ’bout Bikes”: virtual-elevation field testing and roller-based tire rolling-resistance testing (the DIY-VE lineage). bikeblather.blogspot.com
- Karrasch J. Gravel and mountain-bike tire rolling-resistance testing (Chung virtual-elevation method). Data: johnkarrasch.com. See also “The first efficiency tests of 29-inch vs. 32-inch tires tell us bigger is (probably) faster,” Escape Collective, 17 March 2026, escapecollective.com.
- Specialized Bicycle Components. Crux gravel platform, “Time to Finish” methodology. 2026.
- Mc Laughlin R. “Introducing Escape tyre testing: Get ready to rethink accepted wisdom.” Escape Collective, 10 December 2025. escapecollective.com
- ISO 2631-1. “Mechanical vibration and shock: evaluation of human exposure to whole-body vibration.” International Organization for Standardization.
- Specialized Bicycle Components. “S-Works Tarmac SL9 White Paper” (Equation of Speed). 2024.